The Dow hasn't seen a month-long range this narrow since at least 1957

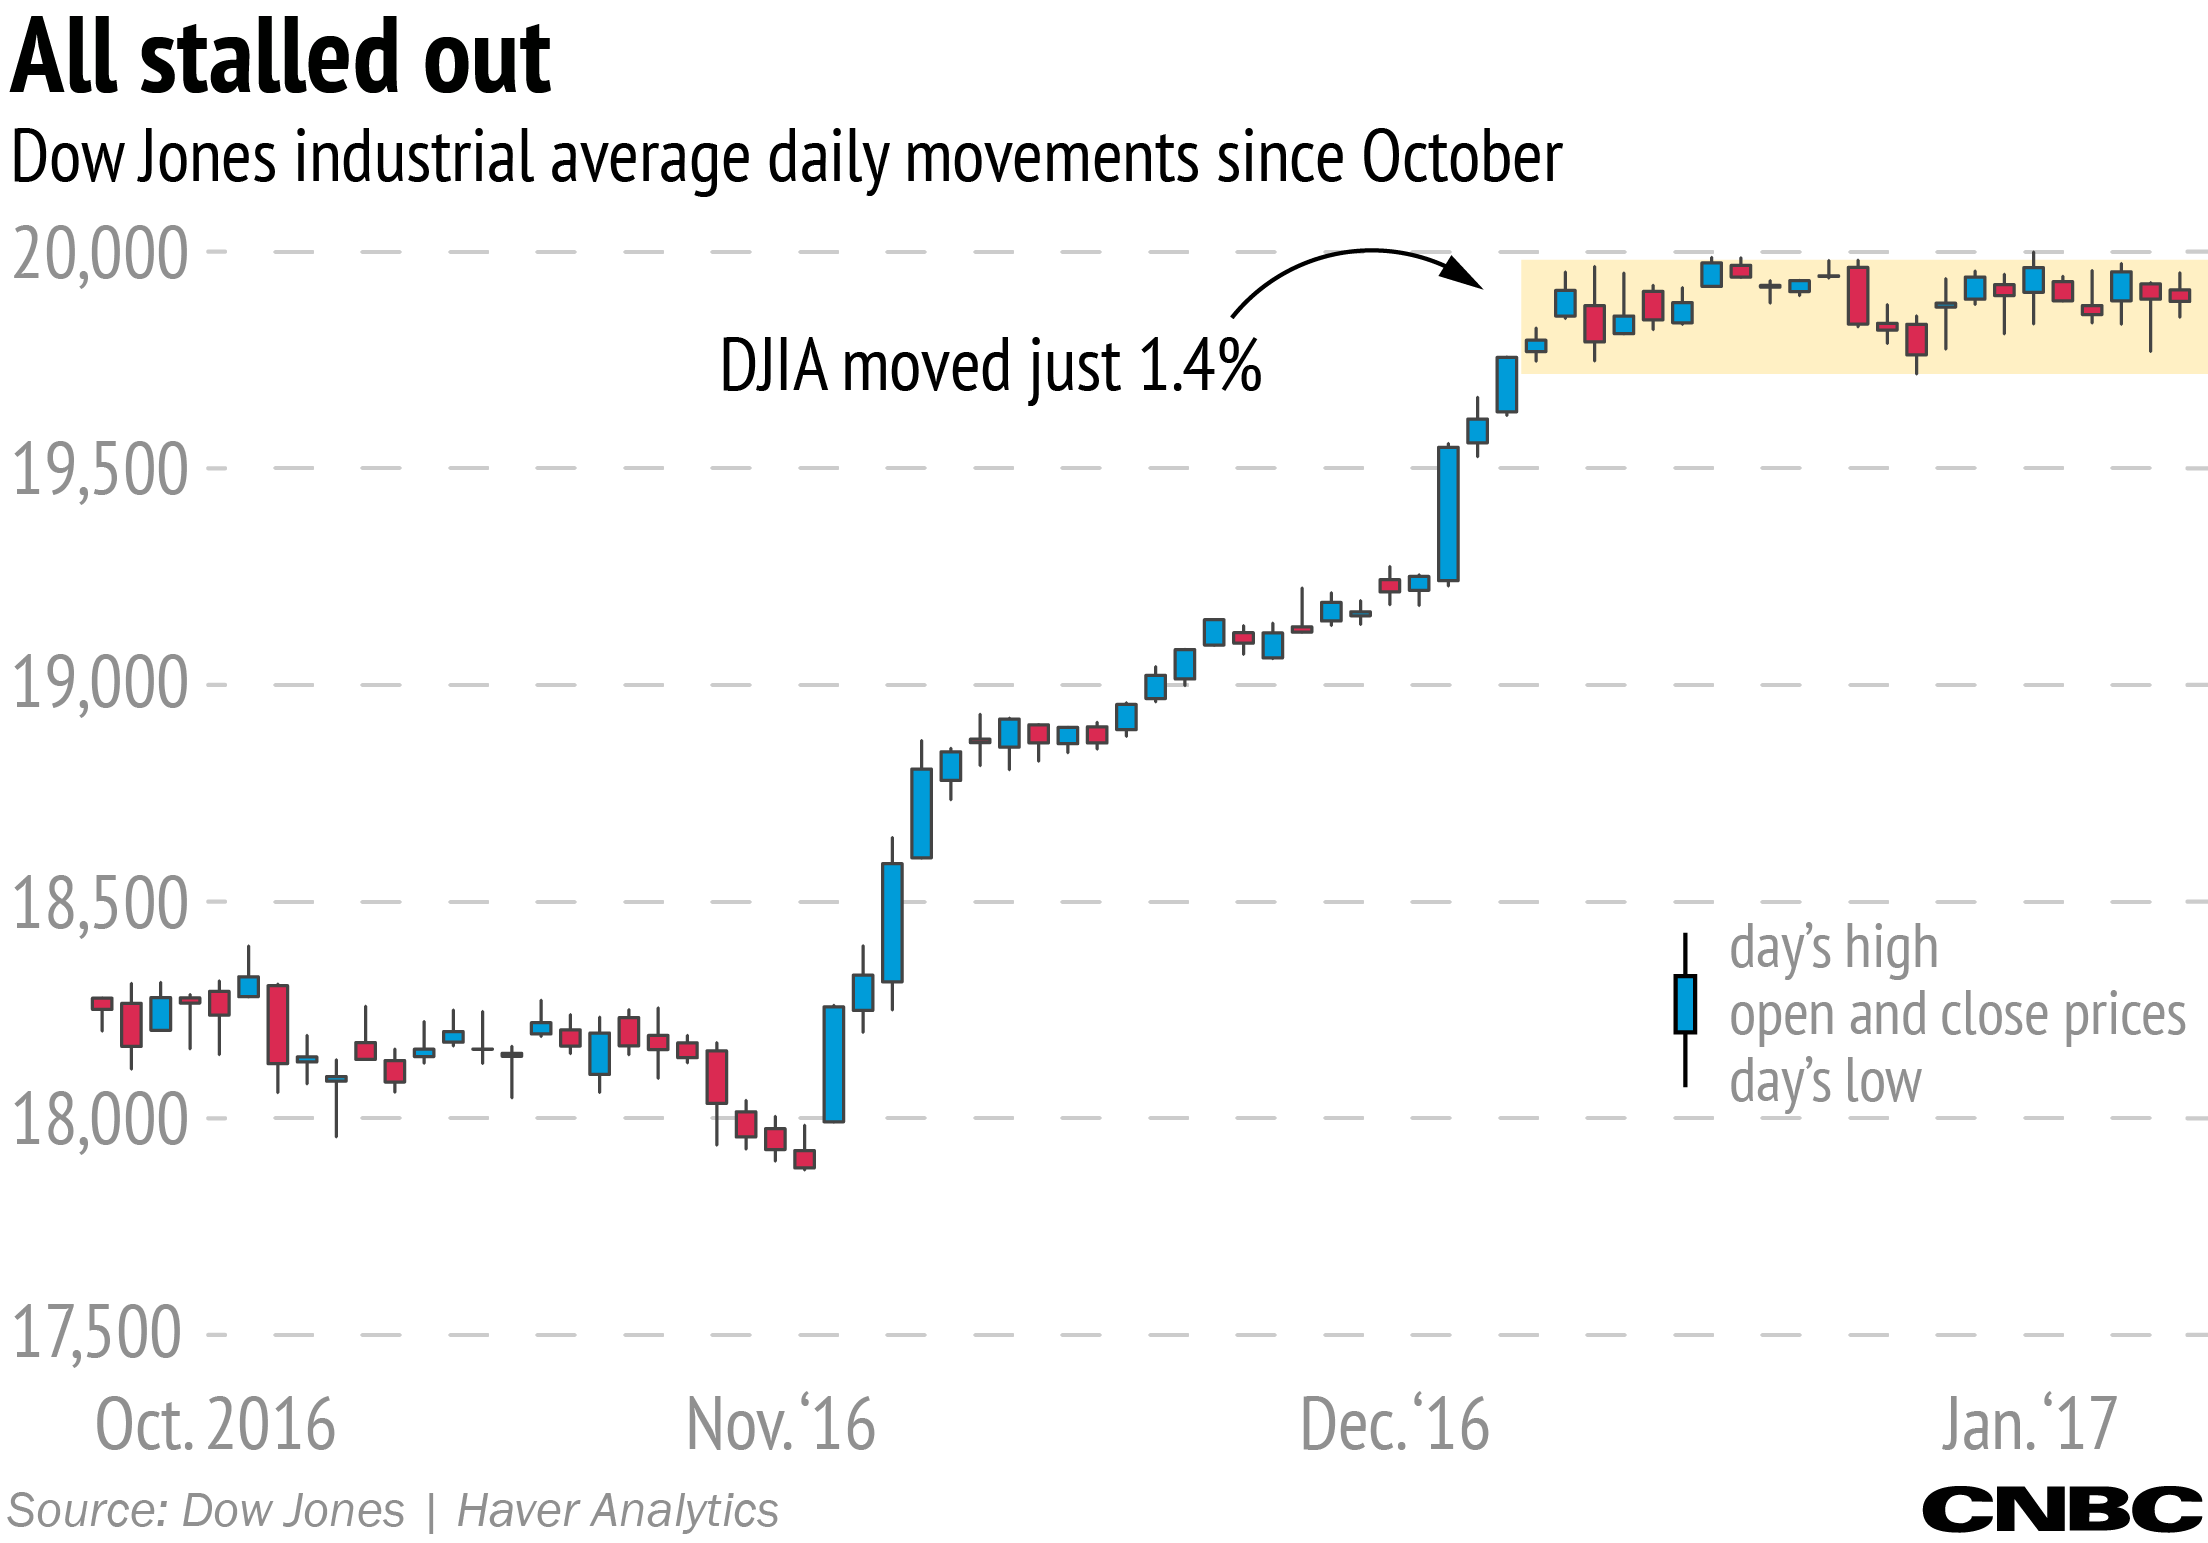
If it seems like the stock market's crawl to nowhere over the past month has been particularly strange, that's because it has been. It turns out the gap between the Dow's high and low prices over the past month is a tiny 1.4 percent — the narrowest gap in data going back to 1957.

It was just over a month ago, on Dec. 13, when we saw the Dow Jones industrial average cross 19,900 for the first time. Since then, we've seen an intraday high of 19999.63 and a low of 19719.67. The gap between those two levels is only 1.4 percent. The Dow's entire past month has stayed within that extremely tight range.

To put this in perspective: We usually see a 6 to 7 percent average range in a typical month. In fact, the typical trading day in the past 60 years has seen a 1.5 percent move just on that day alone.

That's why such a narrow range for an entire month is beyond normal, and something you wouldn't be able to forecast.

Before this 1.4 percent range (1.42 to be precise), the previous records for lowest one-month ranges were 1.85 percent in August 2005, 2.17 percent in December 2004 and 2.25 percent all the way back in November 1964. Yes, 1964.

We don't know what this means for future performance. Some traders have suggested a narrow range indicates increased volatility to come. But there hasn't been anything else like this: the narrowest range we've ever seen, while the market is at an all-time high.